⚡ Electromagnetism · 6 December 2017
How Do Solar Cells Work?
In 2023, the world added more solar power capacity than all other energy sources combined. Solar cells — also called photovoltaic (PV) cells — are at the heart of this transformation, silently converting sunlight into electricity with no moving parts, no combustion, and no emissions. Understanding how they work requires quantum mechanics, semiconductor physics, and a clear look at the Sun's spectrum.
The Energy Source
The Sun is powered by nuclear fusion: in its core at temperatures of ~15 million K, hydrogen nuclei fuse into helium, releasing energy according to Einstein's mass-energy equivalence:
About kg of hydrogen converts to helium every second. The Sun radiates watts in all directions. At Earth's distance (1 AU = 150 million km), about 1,361 watts per square meter (the solar constant) arrive at the top of the atmosphere — but after reflection and absorption by clouds, aerosols, and atmospheric gases, the surface typically receives 200–1,000 W/m², depending on location, season, and weather.
This isn't just a lot of energy — the Sun delivers more energy to Earth in 90 minutes than humanity uses in a year.
The Photoelectric Effect: Light as Quanta
The physics underlying solar cells begins with the photoelectric effect, explained by Einstein in 1905 (the work for which he won his 1921 Nobel Prize, not relativity). See The Photoelectric Effect for the full story.
Light is not a continuous wave but comes in discrete packets called photons, each carrying energy:
where J·s is Planck's constant, is frequency, is the speed of light, and is the wavelength. A blue photon ( nm) carries about 2.75 eV; a red photon ( nm) carries about 1.77 eV; a near-infrared photon ( nm) carries about 1.13 eV.
The Band Gap: The Key Concept
In a semiconductor, electrons occupy a range of allowed energy levels called the valence band — the band that's filled at low temperature. Above it is a forbidden range of energies called the band gap, followed by the conduction band — where electrons can move freely and conduct electricity.
For silicon, the band gap is 1.12 eV at room temperature.
When a photon strikes a silicon crystal:
- If eV (infrared light): the photon passes through. Silicon is transparent to infrared.
- If eV (visible and UV): the photon is absorbed, promoting an electron from the valence band to the conduction band, leaving behind a hole in the valence band.
- If eV (UV light): the photon is absorbed and creates an electron-hole pair, but the excess energy above the band gap is lost as heat (thermalization).
This spectral mismatch is the fundamental reason solar cells can't be 100% efficient.
The P-N Junction: Separating Charges
Absorbing a photon and creating an electron-hole pair is not enough to generate electricity. If the electron and hole simply recombine in the same place, all the energy is released as a photon (photoluminescence) or heat — wasted. We need a way to separate the charges and force them to travel through an external circuit.
This is the role of the p-n junction (see the P-N Junction article for full details). At the junction, the built-in electric field — the result of the charge separation between the n-type and p-type regions — sweeps electrons toward the n-type side and holes toward the p-type side before they can recombine.
The separated charges create a voltage across the cell. Connect the two sides with a wire and current flows: electrons travel through the external circuit from the n-side to the p-side, performing electrical work along the way, then recombine with holes at the p-side. This is the photovoltaic effect.
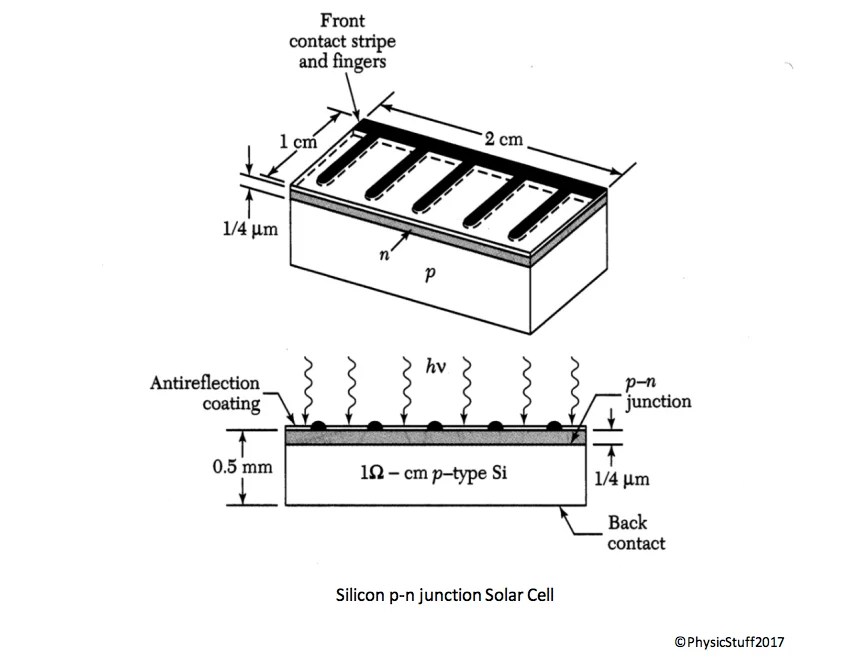
Cell Anatomy
A typical silicon solar cell consists of:
- Anti-reflective coating (silicon nitride, ~75 nm thick): Reduces reflection from ~35% to ~5%. The familiar blue or black color of solar panels comes from this coating — without it, silicon would appear silver-gray.
- N-type emitter layer (~0.5 μm): Heavily doped n-type silicon at the front surface
- P-type base (~300 μm): Lightly doped p-type silicon making up most of the cell
- Metal grid contacts on front: Thin fingers that collect current without blocking too much light — a trade-off between electrical resistance and optical shading
- Full back contact: Metal layer on the back, reflecting unabsorbed light back through the cell for a second pass
Efficiency Limits
The Shockley-Queisser Limit
In 1961, William Shockley and Hans-Joachim Queisser calculated the theoretical maximum efficiency for a single-junction solar cell under the standard solar spectrum. The result: ~33.7% for an ideal material with an optimal band gap of about 1.34 eV.
The losses that prevent reaching 100% efficiency:
| Loss Mechanism | Cause |
|---|---|
| Thermalization | Photons with waste excess energy as heat |
| Transmission | Photons with pass through the cell unabsorbed |
| Recombination | Generated carriers recombine before reaching contacts |
| Reflection | Some light bounces off the front surface |
| Resistive losses | Current flowing through contacts generates heat |
The best single-junction silicon cell ever made achieves 26.8% (Kaneka Corporation, 2017) — approaching but not reaching the Shockley-Queisser limit for silicon's 1.12 eV band gap.
Commercial silicon panels sold today typically achieve 18–22% efficiency.
Tandem Cells: Beating the Limit
The Shockley-Queisser limit applies to a single junction. By stacking multiple junctions with different band gaps, the spectral mismatch losses can be dramatically reduced.
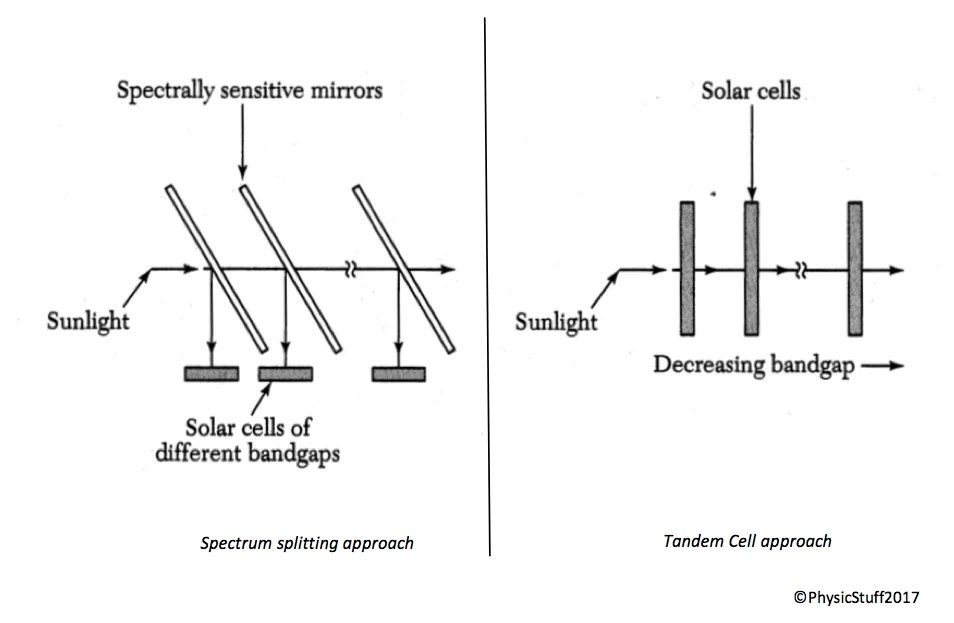
The top cell has the highest band gap — it absorbs energetic blue/violet photons. Lower-band-gap cells underneath absorb the transmitted red and infrared photons. Each sub-cell uses photons close to its band gap energy, minimizing thermalization.
The current record for a solar cell under concentrated sunlight is 47.6% (Fraunhofer ISE, 2022) using a six-junction concentrator cell. Under normal (non-concentrated) sunlight, the record is 39.5% for a triple-junction cell.

Beyond Silicon
Silicon dominates the market (>90% of installed capacity) due to its abundance, non-toxicity, well-understood physics, and mature manufacturing base. But several alternative technologies are commercially available or in advanced development:
| Technology | Efficiency (commercial) | Key Advantage |
|---|---|---|
| Silicon (monocrystalline) | 20–22% | Proven, abundant |
| Silicon (polycrystalline) | 16–18% | Lower cost |
| CdTe (cadmium telluride) | 19–22% | Low cost thin film |
| CIGS | 15–18% | Flexible substrate possible |
| Perovskite | 25%+ (lab, unstable) | Cheap, high efficiency potential |
| III-V (GaAs etc.) | 28–32% | Space applications |
Perovskites — materials with the ABX₃ crystal structure — have risen from ~4% efficiency in 2009 to over 26% in 2024, the fastest efficiency increase of any solar technology. Their main challenge: long-term stability under UV exposure and humidity.
Levelized Cost of Energy
The relevant metric for comparing energy sources is LCOE (Levelized Cost of Energy), which accounts for the full lifecycle cost divided by total energy produced. In 2023, utility-scale solar LCOE in favorable locations (Southern US, Middle East, India) fell below $20 per MWh — cheaper than natural gas, coal, nuclear, and most other sources.
A watt of solar capacity installed today will silently produce electricity for 25–30 years with essentially no maintenance, no fuel cost, and no emissions after the initial manufacturing energy is repaid (typically within 1–3 years of operation). The "energy payback time" — how long it takes a solar panel to produce the energy that went into making it — continues to fall as manufacturing efficiency improves.
Explore more simulations
Every concept on PhysicStuff has an interactive simulation. No login, no setup required.